Sidequest Dashboard
The Sidequest Dashboard is a comprehensive web interface for monitoring, managing, and debugging your job processing system. It provides real-time insights into job execution, queue performance, and system health.
Overview
The dashboard is automatically included with Sidequest and provides:
- Real-time monitoring with live updates every 1-3 seconds
- Job management including running, canceling, and re-running jobs
- Queue control for pausing, activating, and monitoring queues
- Performance analytics with historical charts and statistics
- Responsive design that works on desktop and mobile devices
- No external dependencies - runs entirely within your Sidequest instance
Access the dashboard at http://localhost:8678 (or your configured port) once Sidequest is running.
Configuration
Basic Configuration
The dashboard is enabled by default when you start Sidequest:
import { Sidequest } from "sidequest";

// Dashboard runs on default port 8678
await Sidequest.start();

console.log("Dashboard available at http://localhost:8678");
Custom Configuration
Configure dashboard settings during Sidequest startup:
await Sidequest.start({
  dashboard: {
    enabled: true, // Enable/disable dashboard (default: true)
    port: 3000, // Custom port (default: 8678)
    auth: {
      // Optional basic authentication
      user: "admin",
      password: "secure-password",
    },
  },
});
Configuration Options
| Option | Type | Default | Description |
|---|---|---|---|
enabled | boolean | true | Enable or disable the dashboard completely |
port | number | 8678 | Port number for the dashboard server |
basePath | string | "" | Base path for serving behind a reverse proxy (e.g., /admin/sidequest) |
auth.user | string | undefined | Username for basic authentication |
auth.password | string | undefined | Password for basic authentication |
Security Configuration
Basic Authentication
Protect your dashboard with HTTP Basic Authentication:
await Sidequest.start({
  dashboard: {
    enabled: true,
    port: 8678,
    auth: {
      user: process.env.DASHBOARD_USER || "admin",
      password: process.env.DASHBOARD_PASSWORD || "your-secure-password",
    },
  },
});
Production Security
Always enable authentication in production environments. Without authentication, the dashboard is publicly accessible and allows job management operations.
Environment Variables
Use environment variables for secure configuration:
# .env file
DASHBOARD_USER=admin
DASHBOARD_PASSWORD=super-secure-password-2024
DASHBOARD_PORT=3000await Sidequest.start({
dashboard: {
port: parseInt(process.env.DASHBOARD_PORT ?? "8678"),
auth: process.env.DASHBOARD_USER
? {
user: process.env.DASHBOARD_USER,
password: process.env.DASHBOARD_PASSWORD!,
}
: undefined,
},
});Disabling the Dashboard
Disable the dashboard for production or testing environments:
// Completely disable dashboard
await Sidequest.start({
  dashboard: {
    enabled: false,
  },
});

// Conditionally disable
await Sidequest.start({
  dashboard: {
    enabled: process.env.NODE_ENV === "development",
  },
});
Reverse Proxy Configuration
When deploying the dashboard behind a reverse proxy (e.g., nginx, Apache, or a cloud load balancer), you can use the basePath option to serve the dashboard at a specific path prefix.
Using Base Path
await Sidequest.start({
  dashboard: {
    enabled: true,
    port: 8678,
    basePath: "/admin/sidequest", // Dashboard will be served at /admin/sidequest
  },
});
TIP
The basePath ensures all assets, links, and API calls use the correct prefix, making it seamless to integrate the dashboard into your existing application at any path.
Starting only the Dashboard
In some scenarios, you may want to run only the dashboard without starting the Sidequest engine. This is useful for monitoring existing job queues, creating dedicated monitoring instances, or separating concerns in your architecture.
Installation
First, install the dashboard package:
npm install @sidequest/dashboard
# or
yarn add @sidequest/dashboard
You'll also need to install the appropriate backend driver for your database:
# For PostgreSQL (recommended)
npm install @sidequest/postgres-backend

# For SQLite
npm install @sidequest/sqlite-backend

# For MySQL
npm install @sidequest/mysql-backend

# For MongoDB
npm install @sidequest/mongo-backend
Basic Usage
Use the SidequestDashboard class to create a standalone dashboard instance:
// or import form `sidequest` directly if you have the full library
import { SidequestDashboard } from "@sidequest/dashboard";

const dashboard = new SidequestDashboard();

await dashboard.start({
  enabled: true,
  port: 8678,
  backendConfig: {
    driver: "@sidequest/postgres-backend",
    config: "postgresql://localhost:5432/sidequest",
  },
});

console.log("Dashboard available at http://localhost:8678");
Shutting Down
To properly close the dashboard and clean up resources:
// Graceful shutdown
await dashboard.close();
console.log("Dashboard stopped and resources cleaned up");
Dashboard Features
1. Job Statistics Overview
The main dashboard provides real-time job statistics with live updates.
URL: https://localhost:8678
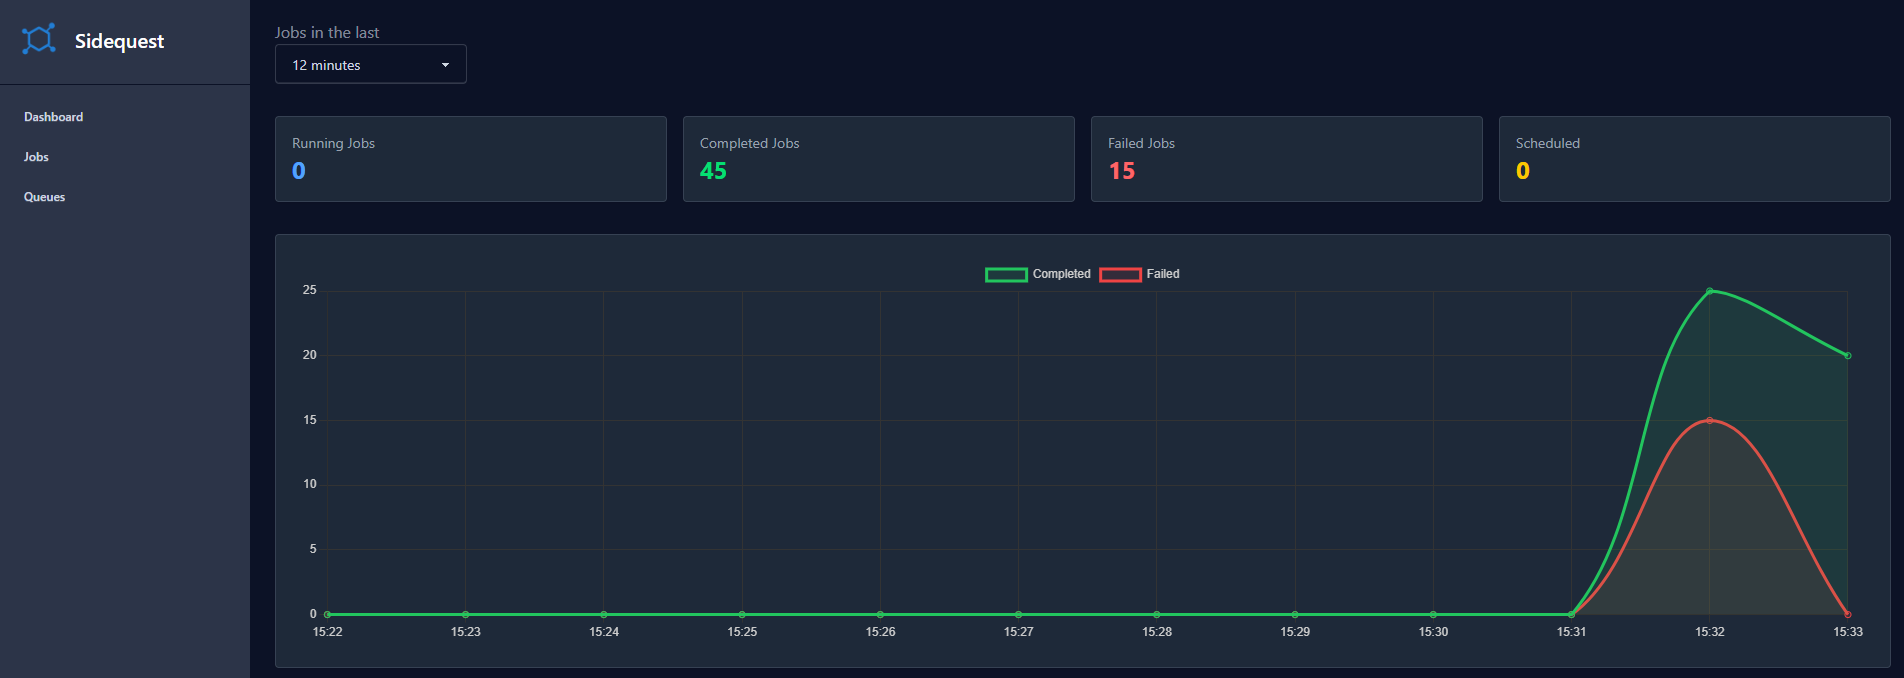
Statistics Cards
- Running Jobs: Currently executing jobs across all queues
- Completed Jobs: Successfully finished jobs in the selected time range
- Failed Jobs: Jobs that failed and exceeded retry attempts
- Scheduled Jobs: Jobs waiting to be executed (including delayed jobs)
Performance Chart
Interactive timeline chart showing job execution over time:
- Time Range Selection: View data for 12 minutes, 12 hours, or 12 days
- Real-time Updates: Automatically refreshes with new data
- Color-coded States: Different colors for completed, failed, and other job states
- Hover Details: Detailed information when hovering over data points
2. Job Management
Job Listing and Filtering
The jobs page provides comprehensive job management with advanced filtering.
URL: https://localhost:8678/jobs
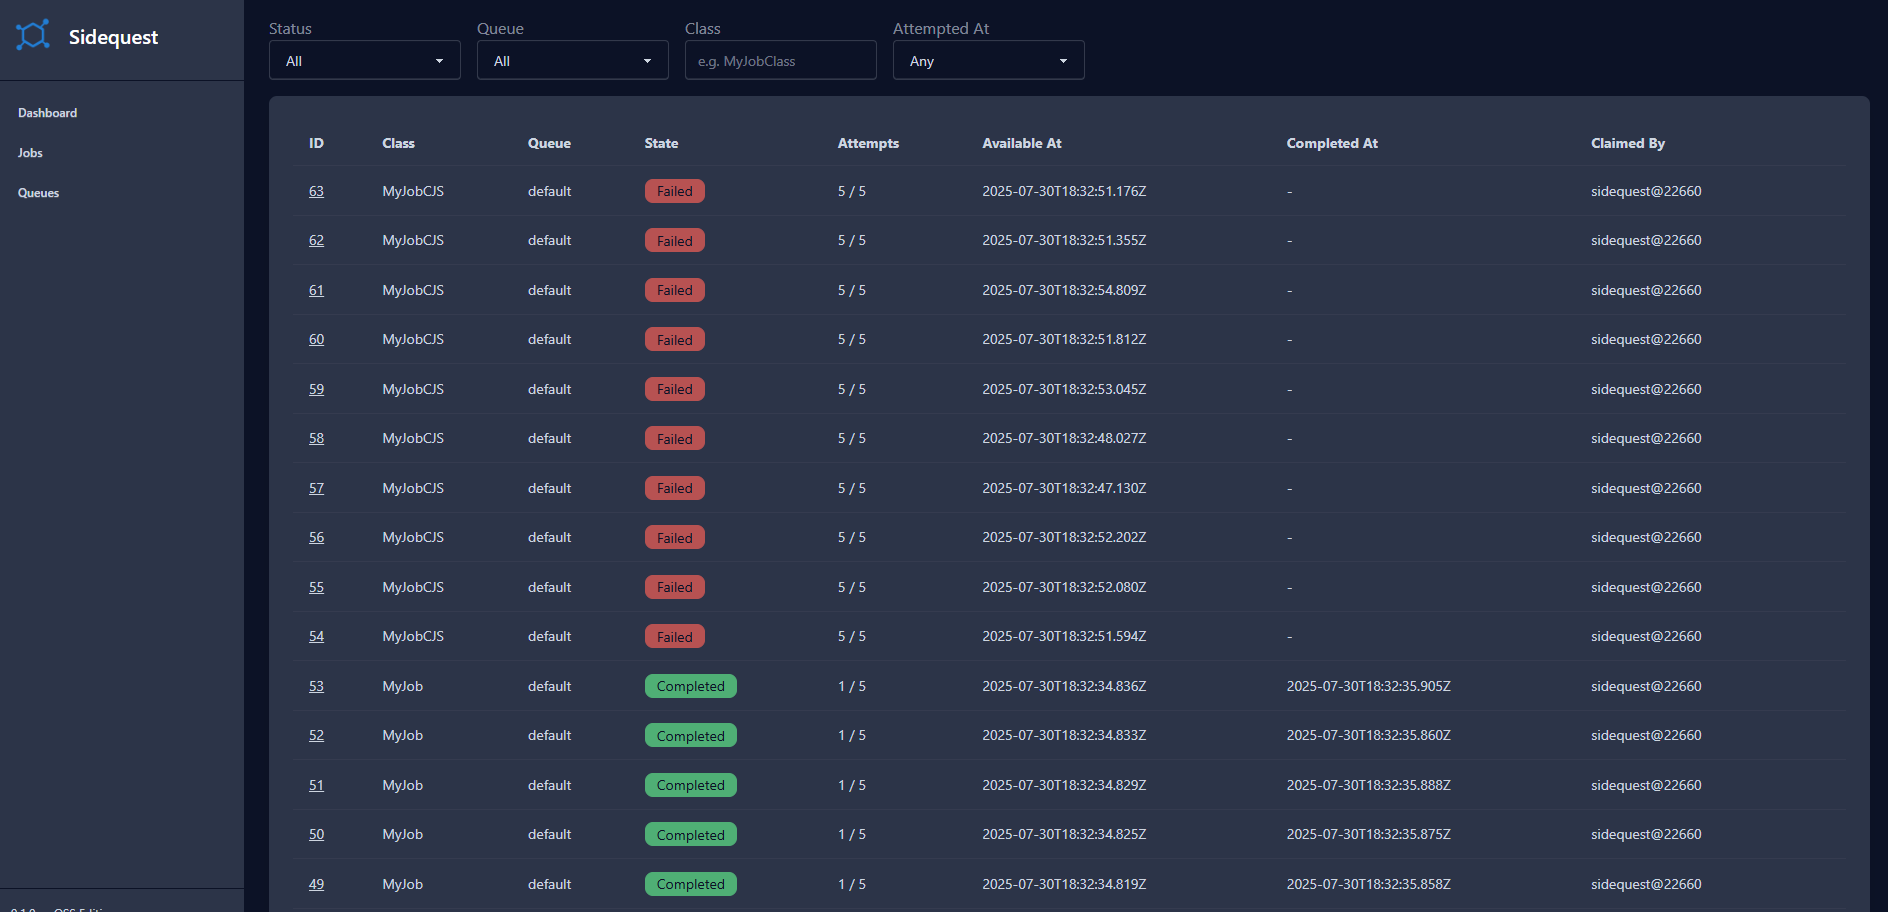
Filter Options:
- Status: Filter by job state (waiting, claimed, running, completed, failed, canceled)
- Queue: Filter by specific queue name
- Class: Filter by job class name (supports partial matching)
- Time Range: Filter jobs by attempted date with preset ranges or custom dates
Available Time Ranges:
- Last 5, 15, 30 minutes
- Last 1, 4, 12, 24 hours
- Last 2, 7, 30 days
- Custom date range with start/end date pickers
Job Table Features
- Sortable Columns: ID, Class, Queue, State, Attempts, Timestamps
- State Badges: Color-coded status indicators
- Pagination: Navigate through large job lists
- Live Updates: Automatic refresh every 3 seconds
- Quick Actions: Run and Cancel buttons directly in the table
Individual Job Actions
Available Actions:
- Run: Make scheduled jobs available immediately
- Cancel: Stop waiting or running jobs
- Re-run: Restart completed, failed, or canceled jobs
- Delete: Remove jobs from the system (coming soon)
3. Job Details View
Click any job ID to view comprehensive job details.
URL: https://localhost:8678/jobs/:jobId
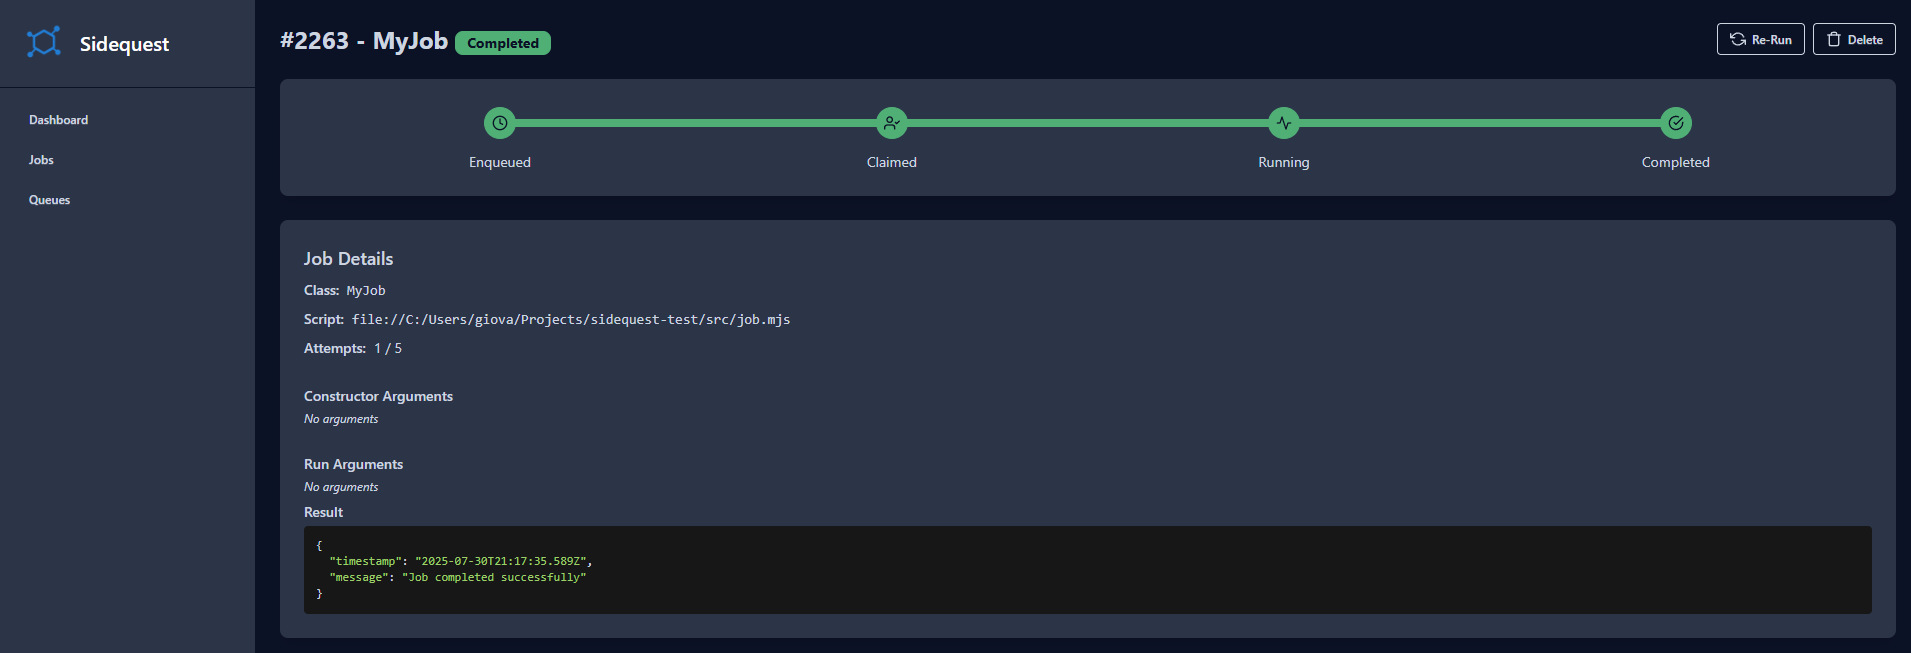
Job Lifecycle Visualization
Visual step-by-step progress showing:
- Enqueued: Job added to queue
- Claimed: Job picked up by worker
- Running: Job currently executing
- Completed/Failed/Canceled: Final state
Detailed Information
- Basic Details: Class name, script path, attempt count
- Constructor Arguments: JSON view of job constructor parameters
- Run Arguments: JSON view of arguments passed to the run method
- Result Data: Output from successful job execution
- Error Information: Stack traces and error messages for failed jobs
Code Viewer
- Syntax Highlighting: JSON formatting for arguments and results
- Expandable Sections: Collapse/expand large data structures
- Copy Support: Easy copying of job data for debugging
4. Queue Management
URL: https://localhost:8678/queues
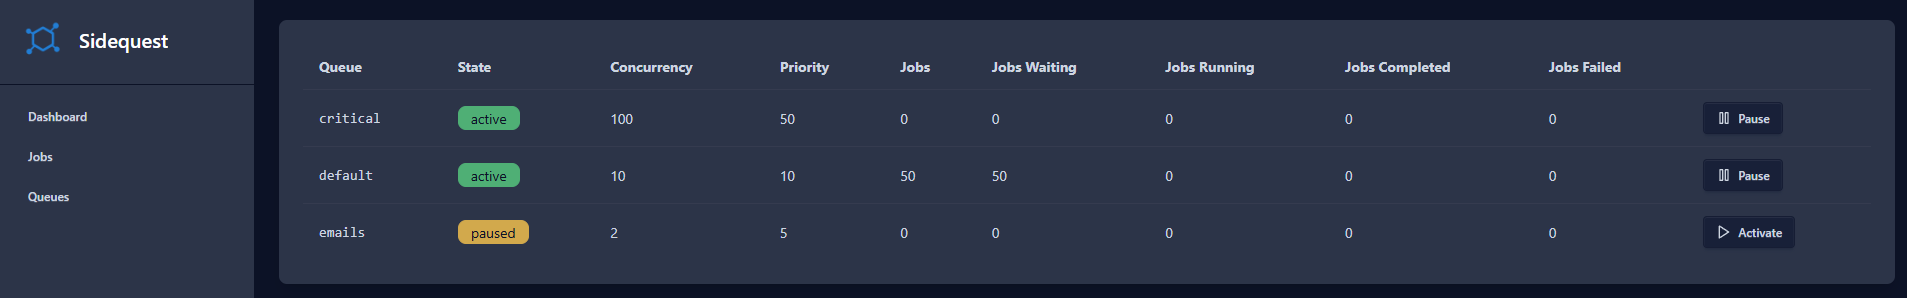
Queue Overview Table
Real-time queue monitoring with:
- Queue Name: Identifier for each queue
- State: Active, paused, or disabled status
- Concurrency: Maximum concurrent jobs allowed
- Priority: Queue processing priority (higher = first)
- Job Counts: Total, waiting, running, completed, and failed jobs
Queue Controls
Management Actions:
- Pause/Activate: Stop or resume job processing for specific queues
- Real-time Updates: Queue status updates every 3 seconds
Queue State Indicators
- Active (Green): Queue is processing jobs normally
- Paused (Yellow): Queue temporarily stopped, jobs accumulate
Using the Dashboard
Navigation
The dashboard includes a clean navigation structure:
Dashboard Home -> Overview and Statistics
├── Jobs -> Job listing, filtering, and management
├── Queues -> Queue status and controls
└── Individual Job -> Detailed job view (accessed via job ID links)
Troubleshooting
Dashboard Not Accessible
Problem: Can't access dashboard at configured URL.
Solutions:
// Check if dashboard is enabled
const config = Sidequest.getConfig();
console.log('Dashboard enabled:', config?.dashboard?.enabled);

// Verify port configuration
console.log('Dashboard port:', config?.dashboard?.port);

// Check for port conflicts
netstat -an | grep :8678  // On Unix systems
netstat -an | findstr :8678  // On Windows
Authentication Issues
Problem: Basic auth not working or credentials rejected.
Solutions:
// Verify auth configuration
await Sidequest.start({
  dashboard: {
    auth: {
      user: "admin",
      password: "password123", // Make sure this matches what you're entering
    },
  },
});

// Test without auth first
await Sidequest.start({
  dashboard: {
    auth: undefined, // Temporarily disable auth for testing
  },
});
Performance Issues
Problem: Dashboard loading slowly or timing out.
Solutions:
- Reduce filter scope: Use smaller time ranges when viewing jobs
- Limit job display: Large job lists can impact performance
- Check database performance: Ensure your backend is optimized
- Monitor memory usage: Large result sets may cause memory issues
Data Not Updating
Problem: Dashboard shows stale data or doesn't refresh.
Solutions:
- Check browser console for JavaScript errors
- Verify network connectivity between browser and dashboard
- Restart Sidequest to reset the dashboard server
- Clear browser cache to resolve cached resource issues
Next Steps
- Job Management - Learn about creating and managing job classes
- Queue Configuration - Understand queue setup and optimization
- Engine Configuration - Configure the underlying engine settings